One crucial and highly beneficial aspect of Six Sigma is all the statistical and analytical tools it comes with. All of them can help a business and its management gain deeper and more complete understanding of the business processes implemented, so they can be optimized and adjusted for a higher standard of results and outcomes.
One such curious and powerful concept is the Taguchi Loss Function (named for Genichi Taguchi), which is used to assess the financial impact of deviating from the target or optimal performance level, usually set by the customer.
What does the Taguchi Loss Function measure exactly
One of the core assumptions of Six Sigma is that not allowing the outcomes of business processes to deviate from the target is bound to create value for the particular organization. As you drift away from the target, the performance of the process, product or service starts to degrade in the eyes of your customer.
When examining this concept, one can intuitively incur that there is going to be a correlation between not meeting the quality target and waste of resources. Of course, whenever resources are wasted and whenever the quality of the results from a business process is low, this is going to have some financial ramifications that can be interpreted as a loss. This is exactly what the Taguchi Loss Function measures and what it is used to represent graphically.
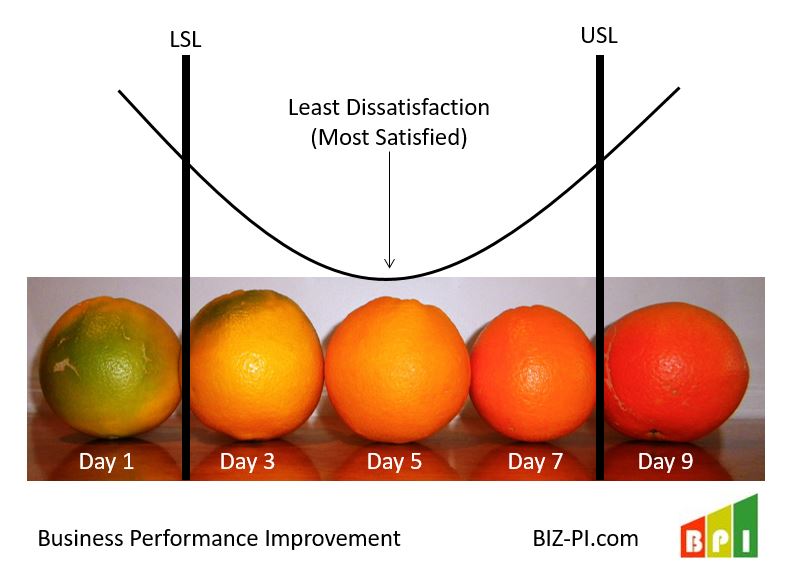
When the outcome of a business process is exactly as targeted with zero deviation, the Taguchi Loss Function also has a value of zero. As deviation increases, the loss incurred and measured by the function increases in a quadratic manner. Even deviation within the Six Sigma range incurs some nominal loss, and that loss does not appear suddenly at its boundary, but increases gradually with the increase in deviation.

If we use the image above, we see that the ideal orange has ripened at Day 5. This is where the customer is most satisfied (or least dissatisfied). If we move one day earlier or later, we start to incur some dissatisfaction, as it is no longer the best orange possible. Even if it is acceptable to sell an orange on Day 3 or Day 7, those oranges are not as good as Day 5 oranges.
Learn more about this example of the Taguchi Loss Function with oranges >>>
When is the Taguchi Loss Function useful
When a business decides to optimize a particular process, or when optimization is already in progress, it’s often easy to lose focus and strive for lowering deviation from the target as an end goal of its own. But whenever we are talking about business, the most important and the most fundamental metric is always the profit. In that sense, the Taguchi Loss Function can be extremely valuable, as it is a tool that can transform deviation from target to a value with a financial representation, which affects the bottom line directly. Going back to the orange example, the customer would be getting an orange with less value on Day 3 or Day 7, yet paying the same price as Day 5 oranges. This may lead to financial impacts of lost future sales or more customer returns.
This is why this tool is widely used when selecting business processes to optimize first. Applying the function allows for the managers and consultants to measure the financial impact that the planned process improvement would have for the organization. This means that every project can be evaluated with a specific value for its potential financial impact. which makes prioritization a much easier and more informed decision.
The most famous case of this concept in practice was Ford’s study of similar transmission parts manufactured by an overseas supplier (likely Mazda). They found that they had superior performing parts due to less variation, even though all parts were within specification limits. Note: you can skip ahead to 5:08 where they discuss the specific study.
A more general usage
Despite the fact that the Taguchi Loss Function in the context of Six Sigma is generally used to measure the correlation between process performance and financial loss, it actually doesn’t have to be limited at that. It can be used to measure and predict the resulting losses in a wide variety of other metrics like customer satisfaction, product quality and employee time utilization efficiency.
The Taguchi Loss Function is an invaluable resource when planning and strategizing. This is why it is not a tool that is utilized just by Six Sigma alone, but by a wide variety of other business process optimization methodologies like Lean and Lean Six Sigma.
What we find most valuable with Taguchi Loss Function is the concept and change in mindset that it brings. It helps people realize that variation has a financial impact, and a company should not be complacent with quality just because they are meeting the specification limits. As the video showed, reduced variation can be a competitive advantage in your industry!
How does the Taguchi Loss Function apply to your work? Add your comment below…


No responses / comments so far.