What Is a P-Value?
Statistics is not an easy field, and anyone who’s had to analyze large volumes of data can quickly tell you the same. The problem often boils down to the fact that you simply can’t trust some discrepancies in the data, and you have to know where those differences are coming from, and how to interpret them properly.
Today, we have various tools that can help us more quickly identify when a given data set differs from another. The p-value is among the most important statistical terms within Six Sigma, and it’s critical that everyone using statistical analysis fully understands what it means.
Meaning of the P-value
The p-value is a number between zero and 1. It represents the probability that the groups within your data set came from the same distribution or behave similar to each other.
For example, if you are analyzing the time to commute to work, and you take 2 different routes to work, we can use p-values to determine if one route is statistically different than the other route. We always start out by assuming both routes are not different from one another. Then we calculate the average and standard deviations of both routes, and use those results to calculate the P-value.
If the p-value is closer to 1, then we would conclude that the routes are very similar to each other. If the p-value is closer to zero, then we would conclude that the routes are different statistically.
Since nothing in statistics is purely 100% guaranteed, the p-value represents the chance that we are incorrect, if we conclude the routes are different, when in fact, that only occurred in our sample (but not in reality). This could be due to random chance in how we collected our data. The closer the p-value to zero, the less chance that we will have made a mistake.
Typical p-value ranges
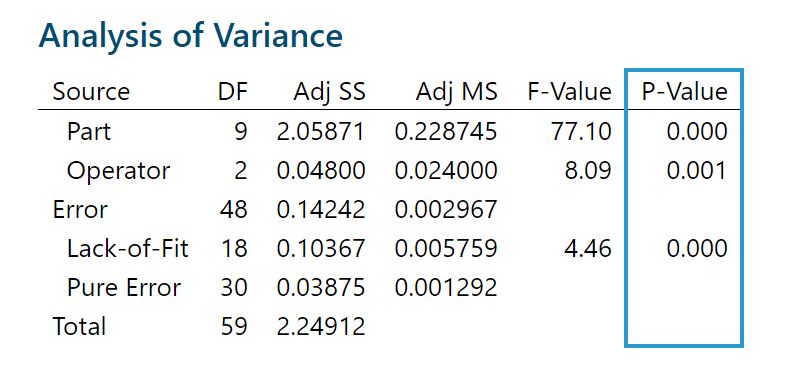
P-values are most interesting around the 0.05 limit, as this is often seen as the cutoff point for valid assumptions. Beneath a value of 0.05, we can make the claim that the risk of making an error is less than 5%, so we conclude that routes are different from one another.
On the other hand, p-values above 0.05 make it difficult for us to conclude that the routes are different, so we state that there is not enough data or evidence to tell them apart.
It’s interesting to note that a p-value that’s almost exactly 0.05 is a unique case, and it’s hard to draw any conclusions from it as the results can easily swing in both directions. In that situation, collecting more data is a good suggestion, to see if the additional results move the p-value closer to 0 or to 1. The other option is to take on slightly more risk of being wrong, if you conclude that the routes are different.
Do I need to memorize these values?
It’s important for anyone working closely with statistics to be able to interpret p-values, both when analyzing their own results, as well as when looking at a data set produced by someone else. In the very least, the 0.05 cutoff point should be memorized, and statisticians have come up with various sayings that can help with that.
The most popular one is:
“If P is low, H0 must go!”
This means that if the p-value is low (less than 0.05), then H0 (the null hypothesis that the groups are equal to each other) must “go”. “Go” would mean that we reject the null hypothesis (H0) and conclude that there is a statistical difference between the groups. Make sense?
Conclusion
Statistics can be very powerful, but can also be scary for many, especially if it isn’t something they use often.
Understanding the importance of the p-value as described in this article is a valuable skill for anyone involved in process improvement and especially Six Sigma. When p-values become commonplace in the work environment, you will know that your culture has made a tremendous shift in thinking!
Do you know any other ways to remember p-values compared to hypothesis tests? Add your comments below…


No responses / comments so far.