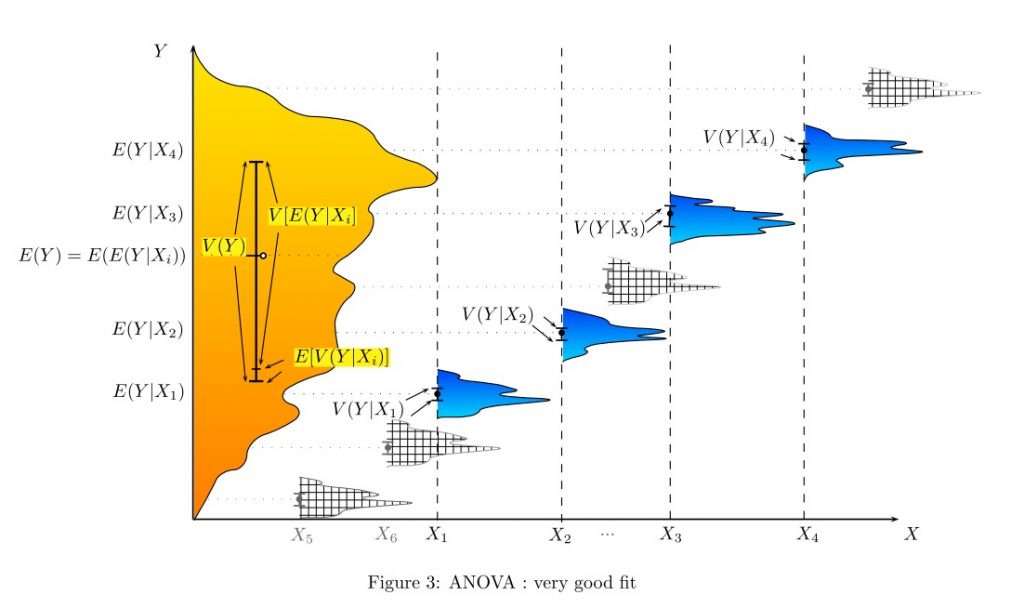
If you take a Six Sigma Green Belt or Black Belt training class, Analysis of Variance (ANOVA) is a core analysis tool that is taught. It is used to split variability from a data set into two key groupings: random factors (noise) and systemic factors (significant).
The ANOVA test is a useful tool that helps you establish what impact independent variables (inputs) have on dependent variables (outputs) within a regression model, experimental design or multi-variable study. For instance, ANOVA can be used to determine differences in the average Intelligence Quotient (IQ) scores of people from different countries (e.g. Spain vs. US vs. Italy vs. Canada).
In this example, the IQ scores would be considered the dependent variable, and countries would be an independent variable.
ANOVA provides a statistical test of whether the averages of several groups are equal, and therefore generalizes the traditional t-test to more than two groups, referred to as an F-test. If there were statistical differences between the average IQ scores within each country, then we would conclude that country is a systemic (significant) factor in explaining variation in IQ scores.
Many statistical packages can perform ANOVA analysis and help you determine which of your independent variables are significant, which makes the calculations much easier these days.
The History and Purpose of ANOVA
For the purpose of this type of comparison test, which was developed during the 20th century, t-tests were the primary analysis tools available to analysts until 1918, the year when Ronald Fisher created ANOVA.
However, the term only became a buzzword in 1925 after it appeared in his book, Statistical Methods for Research Workers.’ Initially, the method found application in experimental psychology, but was later employed to wider applications such as farming and manufacturing. As a nod to its creator, the test is also known as the Fisher Analysis of Variance.
The ANOVA test is the first step when analyzing the factors that affect a data set, after assumptions have been validated. After the test has been completed, you can perform further tests on the factors which contribute to the variability, or discover that there are more factors not captured in your data that are missing from your analysis.
From the ANOVA analysis, a percentage of explained variation can be calculated (called an R-squared value), which is a number between 0% and 100%. If your analysis shows a percentage of only 33%, likely you are missing some important variables from your data set, and should find ways to gather additional data and re-run your analysis.
Types of ANOVA
Analysis of variance comes in two distinct forms: one-way and multiple. In a one-way ANOVA, the evaluation carried out is with regard to the impact of a single factor on only one dependent variable. This analysis helps to determine if all categories or groups studied are the same within that variable (such as each country). The purpose of the one-way ANOVA is to establish if there are statistically significant differences in the average of two or more unrelated groups within your dependent variable.
The multiple ANOVA extends the one-way ANOVA to two or more dependent variables. An example of a multiple ANOVA is where a company seeks to compare productivity of its workers on the basis of four independent variables…
Dependent: Productivity (average number of quality documents produced per hour)
Independent:
- Age (Under 30, 30-50 years old, over 50)
- Job experience in company (less than 5 years, 5-10 years, over 10 years)
- Previous related work experience or education (no or yes)
- Education Level (no high school degree, high school educated, college educated)
In addition to determining which of the 4 variables influence the productivity, it can also identify if any of the variables interact with each other, creating a more complicated relationship. An interaction in this example might be where previous related work experience does not matter for workers with over 10 years experience in the company, but makes a big difference for workers who are under 30 years old and with the company less than 5 years. The impact on productivity changes when you look at the groups of another variable (it’s not consistent across the board).
How Is ANOVA Used?
You will find ANOVA tables displayed in the these 3 popular Six Sigma tools: Regression Analysis, Gage Repeatability and Reproducibility (R&R) studies, and Design of Experiments (DOE).
For instance, a researcher could test students from different colleges in order to find out if the students attending one college are consistently outperforming those from the rest of the colleges. Another example of the applications of the ANOVA test is a researcher testing two different manufacturing processes to find out if one process used to create a product is more cost effective than the other.
You could even compare the beer consumption between regions of the world to see if they are similar or different.
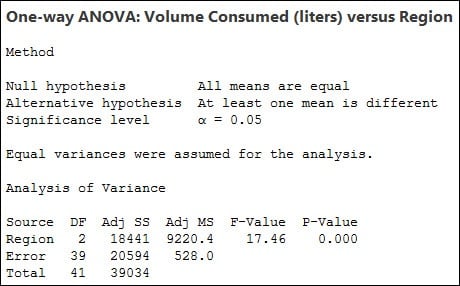
Here is an example of an ANOVA analysis. The bottom section represents the ANOVA table, showing the Region, Error and Total terms. We will not go into the details of this calculation in this article.

Conclusion
If you are familiar with the traditional t-test, you will be excited to learn that the ANOVA test can replace the t-test, as it can handle more complex analyses that are difficult or impossible to perform with the t-test alone. Due to the increase in computing speed over the last few decades, ANOVA has become one of the most popular techniques used to compare group averages, which is needed to understand many research reports and conduct successful Six Sigma projects.
If you would like to learn more about t-tests, F-tests and ANOVA, sign up for Six Sigma Green Belt training with 6sigma.US >>>


No responses / comments so far.