In some organizations, the Customer Service function is largely viewed as a cost center, draining resources of the firm. I maintain that this perspective is what less mature companies support. More mature companies and, subsequently the more successful ones, understand the strategic fit of Customer Service in the overall value chain and it’s functional role in the supply chain.
In what follows, I’ll take a hypothetical iPhone defect case and show how customer service in this example plays a pivotal role in the overall iPhone supply chain ” a key player in the overall product value chain.
Strategic Fit of Customer Service in the Supply Chain
In a supply chain network, the Strategic Fit of Customer Service is often the voice-of-the-customer post-release of the service or product. The phrase start with the customer and work backwards is really a misnomer. Why? Well, in most products or services, it really starts with the customer and ends with the customer ” that is, the customer’s voice is heard at the level of product design and then the voice-of-the-customer is heard at the market monitoring level, post-release of the product or service.
We know ” through pretty accurate anecdotal evidence ” that the supply chain of the iPhone looks like the following:
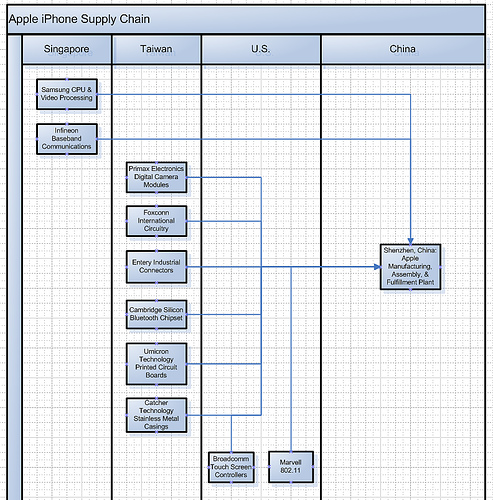
From a high-level, we speculate that the following are the material suppliers of the Apple iPhone:
- Samsung: The Singapore facility manufactures CPU and Video processing chips.
- Infineon: The Singapore facility manufactures Baseband Communications hardware.
- Primax Electronics: The Taiwan facility manufactures Digital Camera Modules.
- Foxconn International: The Taiwan facility manufactures internal circuitry.
- Entery Industrial: The Taiwan facility manufactures connectors.
- Cambridge Silicon: The Taiwan facility manufactures bluetooth chipsets.
- Umicron Technology: The Taiwan facility manufactures printed circuit boards.
- Catcher Technology: The Taiwan facility manufactures stainless metal casings.
- Broadcomm: The U.S. based facility builds touch screen controllers.
- Marvell: The U.S. based facility builds 802.11 specific parts.
- The Apple Shenzhen, China facility assembles the hardware, holds inventory, and handles the pick, pack, and ship steps of the fulfillment process.
If I am correct in any of my research and assertions above, it’s easy to see that if there is any disruption in material flow of any supplier into the Apple Shenzhen, China facility, then production either slows or halts altogether.
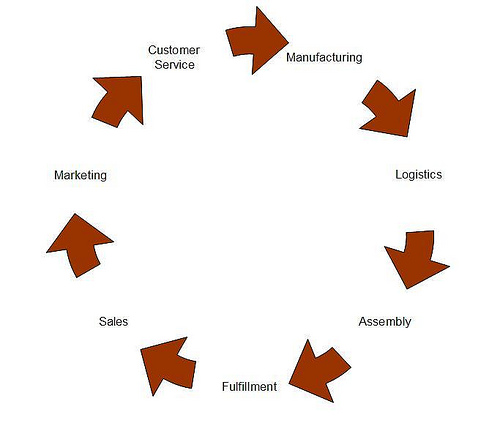
We also know that the Austin, Texas Apple Operation is largely where Apple Care physically sits, with another office just outside of Sacramento, California. So, for any contacts into their Call Center, then that is most likely where the contacts will enter (they also have, we understand, outsourcing partners, but Texas Apple Care is the headquarters).
So, more completely, then, the high-level iphone supply chain may represented like this:
Market Monitoring, Defect Data
When a product is released into the market, there can be many channels of market monitoring of the health of the product. In the medical device or pharmaceutical industry, where I once worked, the Market Monitoring phase of the product lifecycle represents a large portion of the product, especially in how it meets regulatory concerns, etc. Marketing and Public Relations also have an especial interest in market monitoring since the voice-of-the-customer post-release can and, usually does, help the firm improve their product or service.
Let us assume the following:
- Apple Care (Apple iPhone Customer Service) has a program for collecting product health, post-release, of the product. These can be from inbound contacts to the Apple Customer Service or through blogs or through message boards.
- In this program, Apple has a simple and elegant way of making that information actionable, involving collecting data, stratifying of the data, root cause analysis, then practical countermeasures to improve the iPhone through upcoming releases of the product.
iPhone Defect Data
Extending this hypothetical iPhone case, let’s say that Apple Customer Service collects inbound iPhone Defect Data using a very simple check sheet, like the following:
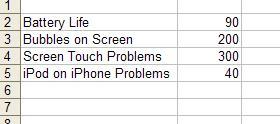
The first column shows very broad defects as reported by the iPhone customers. On the right column are the simple counts. This is called a check sheet. Other variants of this simple quality tool are to collect by day, time, shift, product color, version, etc.
The next step to make this data actionable is to visually render it in a way that points to an healthy area of opprotunity. Below might be a picture that can help us ” an iPhone Pareto of Defects:
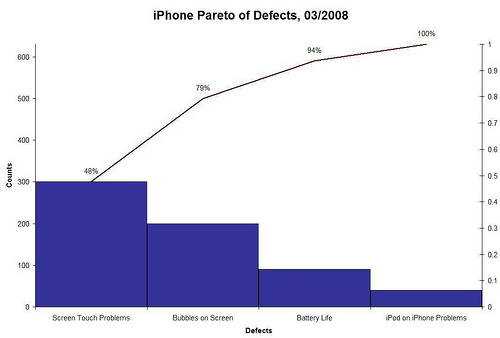
The above picture is a Pareto Chart, showing the check sheet data, in visual format. As a consumer of this data, the Apple Customer Service folks might want to pay closer attention to the first and second bars of the Pareto, because those two bars represent iPhone Touch Screen defects.
The Pareto above naturally leads the consumer of this data to ask Why? ” What’s going on with the Apple iPhone Touch Screen?
The next step, then, in the lifecycle of product monitoring and improvement is to conduct a Root Cause Analysis, focused on areas where the opportunity trade-off is good. In other words, to truly get-to-the-heart of Touch Screen defects, Apple must meet with the suppliers of the iPhone Touch Screen technologies. Based on the Supply Chain network drawn above, Apple should meet with BroadComm, the supplier of the iPhone Touch Screen technologies.
In that meeting, both Apple and the supplier can look over the data, go to the Gemba, and conduct root cause analysis on what’s going on with the Touch Screen.
iPhone Defects Root Cause Analysis
There are several tools that can aid in the process of Root Cause Analysis. Basically, it is a simple approach of asking why several times until you arrive at an atomic but actionable item. To visually view the process of the 5-why’s, a tool called an (Ishikawa Diagram) or a (Cause-and-Effect Diagram) or a (Fishbone Diagram) is often helpful ” this tool is referred by either of these names.
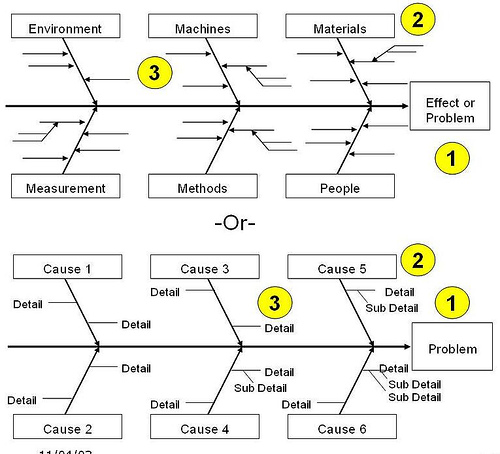
Main Components of an Ishikawa Diagram
- At the head of the Fishbone is the defect or effect, stated in the form of a question.
- The major bones are the capstones, or main groupings of causes.
- The minor bones are detailed items under each capstone.
- There are common capstones, but they may or may not apply to your specific problem. The common ones are:
- People
- Equipment
- Material
- Information
- Methods/Procedures
- Measurement
- Environment
After completing your Fishbone Diagram excercise as a group, it is helpful to test your logic by working the bones: top-down OR bottom-up like:
this happens because of g; g happens because of f; f happens because of e; e happens because of d; d happens because of c; c happens because of b; b happens because of a.
The excercise above is crucially important ” you must test your logic so that it makes pragmatic sense and that the atomic root cause is actionable ” that is, you can do something to correct it, reduce it, or eliminate the root cause.
Once you or your team arrive at a root cause for a specific capstone, then you typically cloud it to identify it as a root cause. A good rule is that there is typically *NOT* 1 root cause for a problem, but potentially several. Below is a diagram of one fishbone, decomposed:
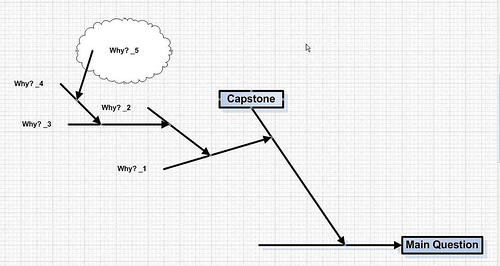
Once the Apple folks and the Apple iPhone Touch Screen supplier arrive at the root causes of the iPhone Touch Screen defects, then the supplier needs to put-in-place countermeasures so that the next shipment of the Touch Screen ” perhaps in the next version of the iPhone ” won’t have this defect anymore.
In fact, there can be much Public Relations and Marketing campaigns from this effort: Apple can show the public that it has listened the concerns of the market; Apple has done this by fixing the defects that most pains that market, in relation to the iPhone product. There can be much branding from an effort like this.
Conclusion
Customer Service plays a key role in the value chain of a product or service. Some firms view and, consequently behave, as if Customer Service were simply a cost center. These firms miss the point altogether: Customer Service is a major vehicle for hearing and learning about what the market is perceiving and feeling and experiencing from our products or services. This data and information can be made actionable through the strategic and smart utilization of Customer Service.
Disclosure
The data above is only hypothetical. The process above works and, if done strategically and with an eye toward the customer, then Customer Service can be a major player in how our products and services can be improved and how we can shape the signals we send to the market and, consequently, how the market can begin to perceive the firm.
I love Apple, but I don’t own an iPhone. I would love an iPhone and would gladly accept a free iPhone from Apple and/or other free Apple products. Apple can join the other companies that have sent me free stuff here.





No responses / comments so far.