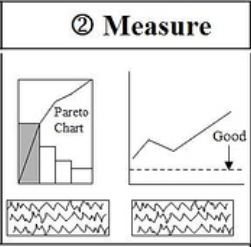
 The Measure Phase is the second phase in the Six Sigma Define-Measure-Analyze-Improve-Control (DMAIC) methodology. In a previous post, we discussed the Define Phase in the Six Sigma DMAIC Methodology and all the elements in that Phase.
During the Measure phase, the focus shifts from “do we agree that X is a problem” to “what’s the phenomena that is happening such that it is a problem?” For example, if a machine is failing, it would be good to know how often, when it’s failing, and other items related to the defect. All of these questions in the Measure Phase is answered with Data. So, it’s no surprise then that in Measure we learn how to apply data analysis in a practical way that helps us to narrow down the problem.
In other words, collect data.
But, it’s not just data. It’s gut or hunch also.
Here’s what I mean: often times, we begin with “hunch” or “gut” and that gives us a good place to start of where to collect data. Ideally, we want to marry our gut hunch with data.
The Objectives of the Measure Phase
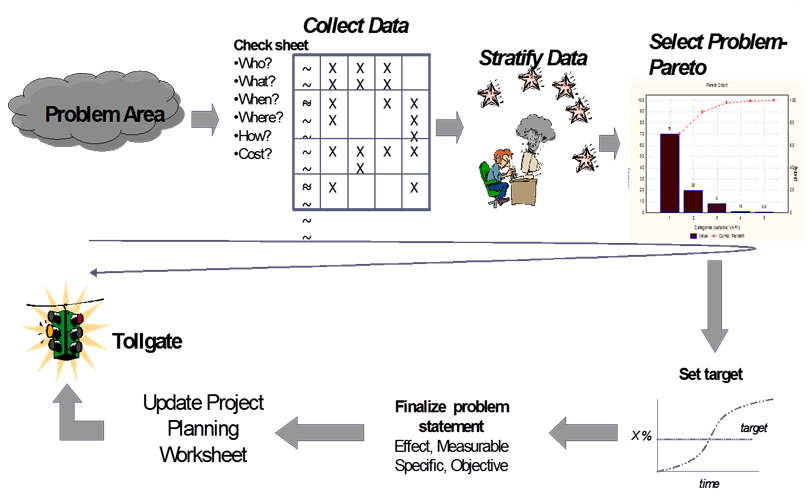
Here’s the Measure Phase Storyboard that sums up the following objective:
Through more detailed analysis, select a problem and problem space that will have the biggest impact on the organization and set an improvement target.

Measure Phase Roadmap
In the Shmula.com Curriculum, we’ll cover the following topics in this section on the Measure Phase. Each topic will contain a video as well as supporting material such as templates and downloads:
- Role of Data
- Distributions
- 7 Quality Tools
- Check Sheets
- Pareto Chart
- Histogram
- Scatter Plot
- Cause and Effect Diagram
- Control Chart
- Run Chart
- Process Cycle Efficiency
- FMEA
- Basic Statistics
- Using Z Values
- Sample Size Calculations
- Introduction to Variation
- Measurement System Analysis
- Gauge R&R
Critical Checkpoints in the Measure Phase
- Plan for and document the results of data collection.
- Establish improvement targets.
- Stratify situation to a component level specific enough to analyze.
- Frame a problem statement clearly and simply, using data.
- Present data using appropriate descriptive charts and graphs.
Measure Tollgate Checklist
By the end of the Measure Phase, you should be able to answer the following:
- How and where did you collect the data?
- Are you using attribute or continuous data and why?
- What does the distribution of your data look like?
- How repeatable and reproducible is your data?
- What is your sampling plan?
- How did you ensure randomness in your data collection?
- What is the current performance of the process?
- How did you establish your improvement target?
This constitutes a basic template for the Measure Phase in Six Sigma and also represents our roadmap ahead in the Shmula.com DMAIC Curriculum.
[contentblock id=16 img=gcb.png]


Comments are disabled for this post.