No matter who you are – rich, old, poor, young, famous, infamous, or not known to anybody – there are a few things that unite us all and we all have in common:
- We all bleed
- We all breath oxygen
- We all put on our pants one leg at a time
- Taxes
- AND – we are all subject to government services, such as the DMV.
Thus was my plight a few weeks ago.
PS: Go here if you’re interested in other articles on Queueing Theory.
Renewing my Drivers License at the DMV
In the United States, every few years you have to renew your Driver’s License at the Department of Motor Vehicles (DMV). So, mine was expired by a few days, I needed to renew it or else I wouldn’t be legally allowed to drive my vehicle.
So, I planned on being at the DMV the second it opened, hoping that things would go quickly and smoothly. I made sure that I brought my Passport, Social Security Card, and 2 proofs of residency for my state, since I moved here out of state.
I arrived at 9:02 AM and there was, unfortunately, a line going out of the building. So, I patiently took my place in the Queue and waited patiently. Even though I had to wait, I received excellent customer service.
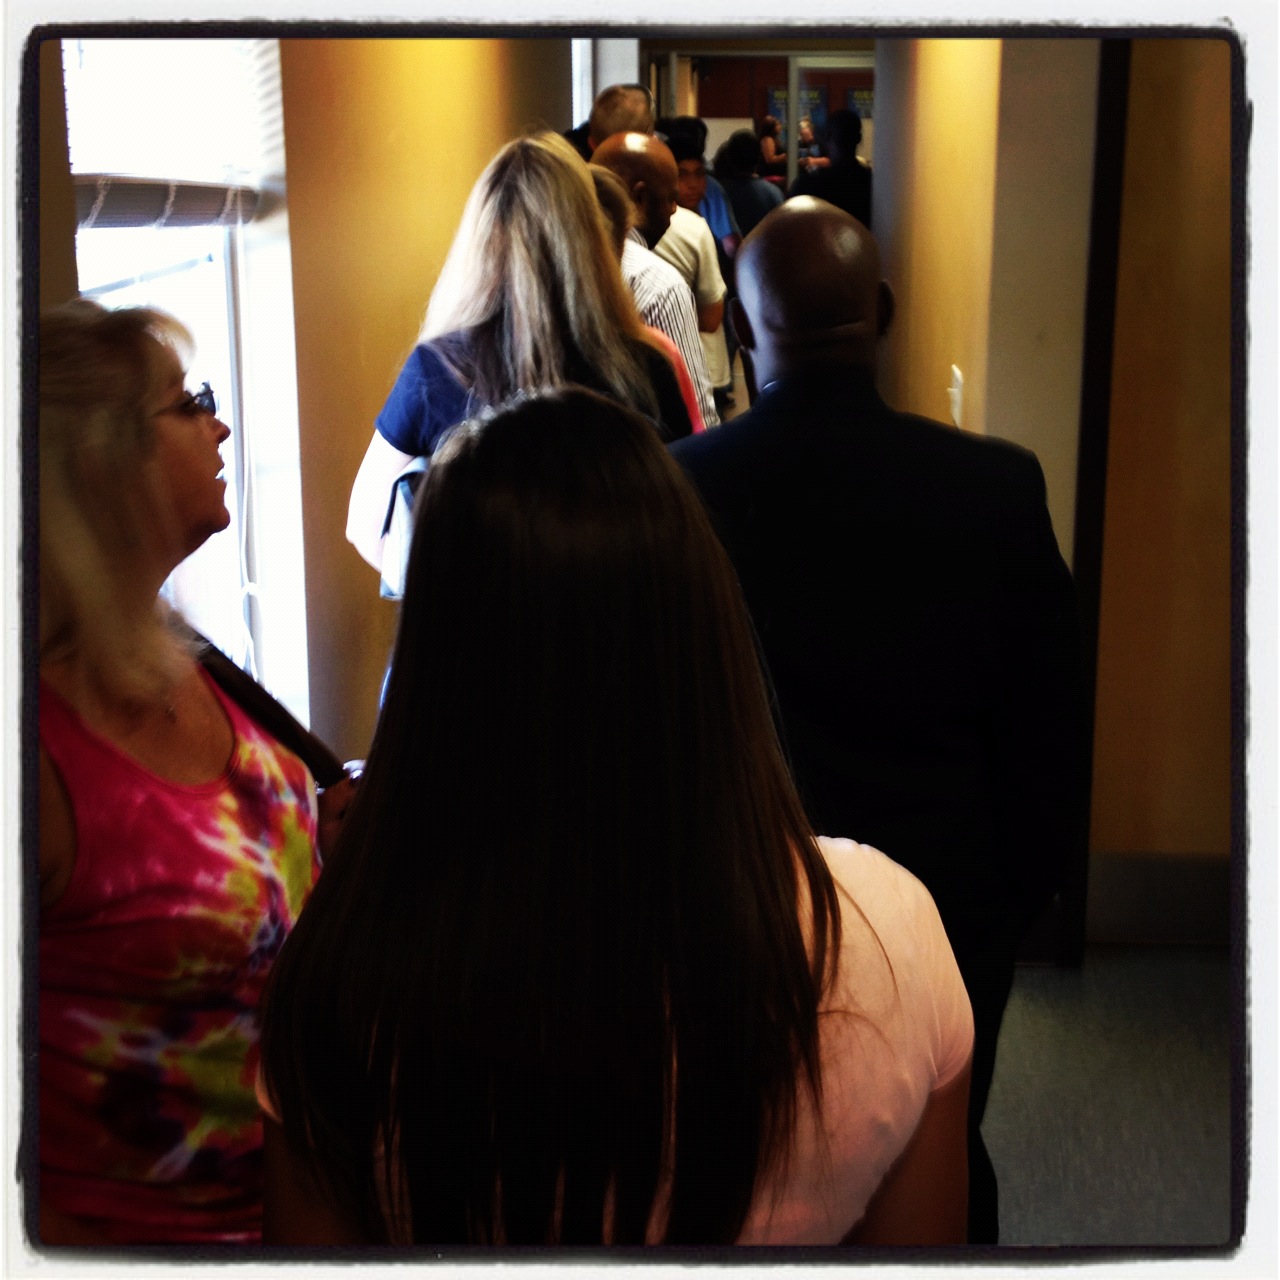
While waiting in line, I thought to myself that I should collect Queueing data. Heck, I have nothing better to do, so below is the data set I collected.
| Cycle # | Start Time | End Time | Service Cycle Time | # of Arrivals | # of Departures |
| 1 | 07-26-2012 09:03:54 AM | 07-26-2012 09:07:55 AM | 240.815754 | 7 | 1 |
| 2 | 07-26-2012 09:07:55 AM | 07-26-2012 09:09:07 AM | 72.783765 | 1 | 1 |
| 3 | 07-26-2012 09:09:07 AM | 07-26-2012 09:10:41 AM | 93.917907 | 2 | 1 |
| 4 | 07-26-2012 09:10:41 AM | 07-26-2012 09:12:28 AM | 106.948664 | 0 | 2 |
| 5 | 07-26-2012 09:12:28 AM | 07-26-2012 09:14:26 AM | 118.004521 | 0 | 2 |
| 6 | 07-26-2012 09:14:26 AM | 07-26-2012 09:16:24 AM | 117.90553 | 1 | 4 |
| 7 | 07-26-2012 09:16:24 AM | 07-26-2012 09:19:22 AM | 177.614429 | 1 | 2 |
| 8 | 07-26-2012 09:19:22 AM | 07-26-2012 09:25:01 AM | 338.985608 | 1 | 1 |
| 9 | 07-26-2012 09:27:16 AM | 07-26-2012 09:28:35 AM | 78.453296 | 2 | 1 |
| 10 | 07-26-2012 09:28:35 AM | 07-26-2012 09:29:42 AM | 67.075174 | 0 | 1 |
| 11 | 07-26-2012 09:29:42 AM | 07-26-2012 09:34:54 AM | 312.357674 | 6 | 1 |
| 12 | 07-26-2012 09:34:54 AM | 07-26-2012 09:35:31 AM | 36.476468 | 0 | 2 |
| 13 | 07-26-2012 09:35:31 AM | 07-26-2012 09:37:17 AM | 106.247341 | 0 | 1 |
Data Definition
To do the above time study of waiting times at the DMV, I just used my iPhone clock and a pencil and paper. Really simple – boring – YES; but simple too.
Here are the definitions of the above data values:
- Start Time / End Time: This is the time from when a customer is called to the DMV officer to when the customer is complete with their transaction. This usually starts with “# xyz come to Desk abc” – at this point I’d start the timer. Then, when the customer leaves that desk, I end the time.
- Cycle Time: This represents the Service Time in seconds, or the difference between Start Time and End Time.
- # of Arrivals: This represents the number of customers who enter the DMV office and begin waiting at the back of the line.
- # of Departures: This number represents the number of customers who exit the building after they have been served by the DMV officer.
Notice that I did not time every single transaction – only the ones that I could. So, what is missing here are the simultaneous transactions. Because I only had 1 timer, I could only time 1 transaction at most. That is why there is a difference between # of Arrivals and # of Departures.
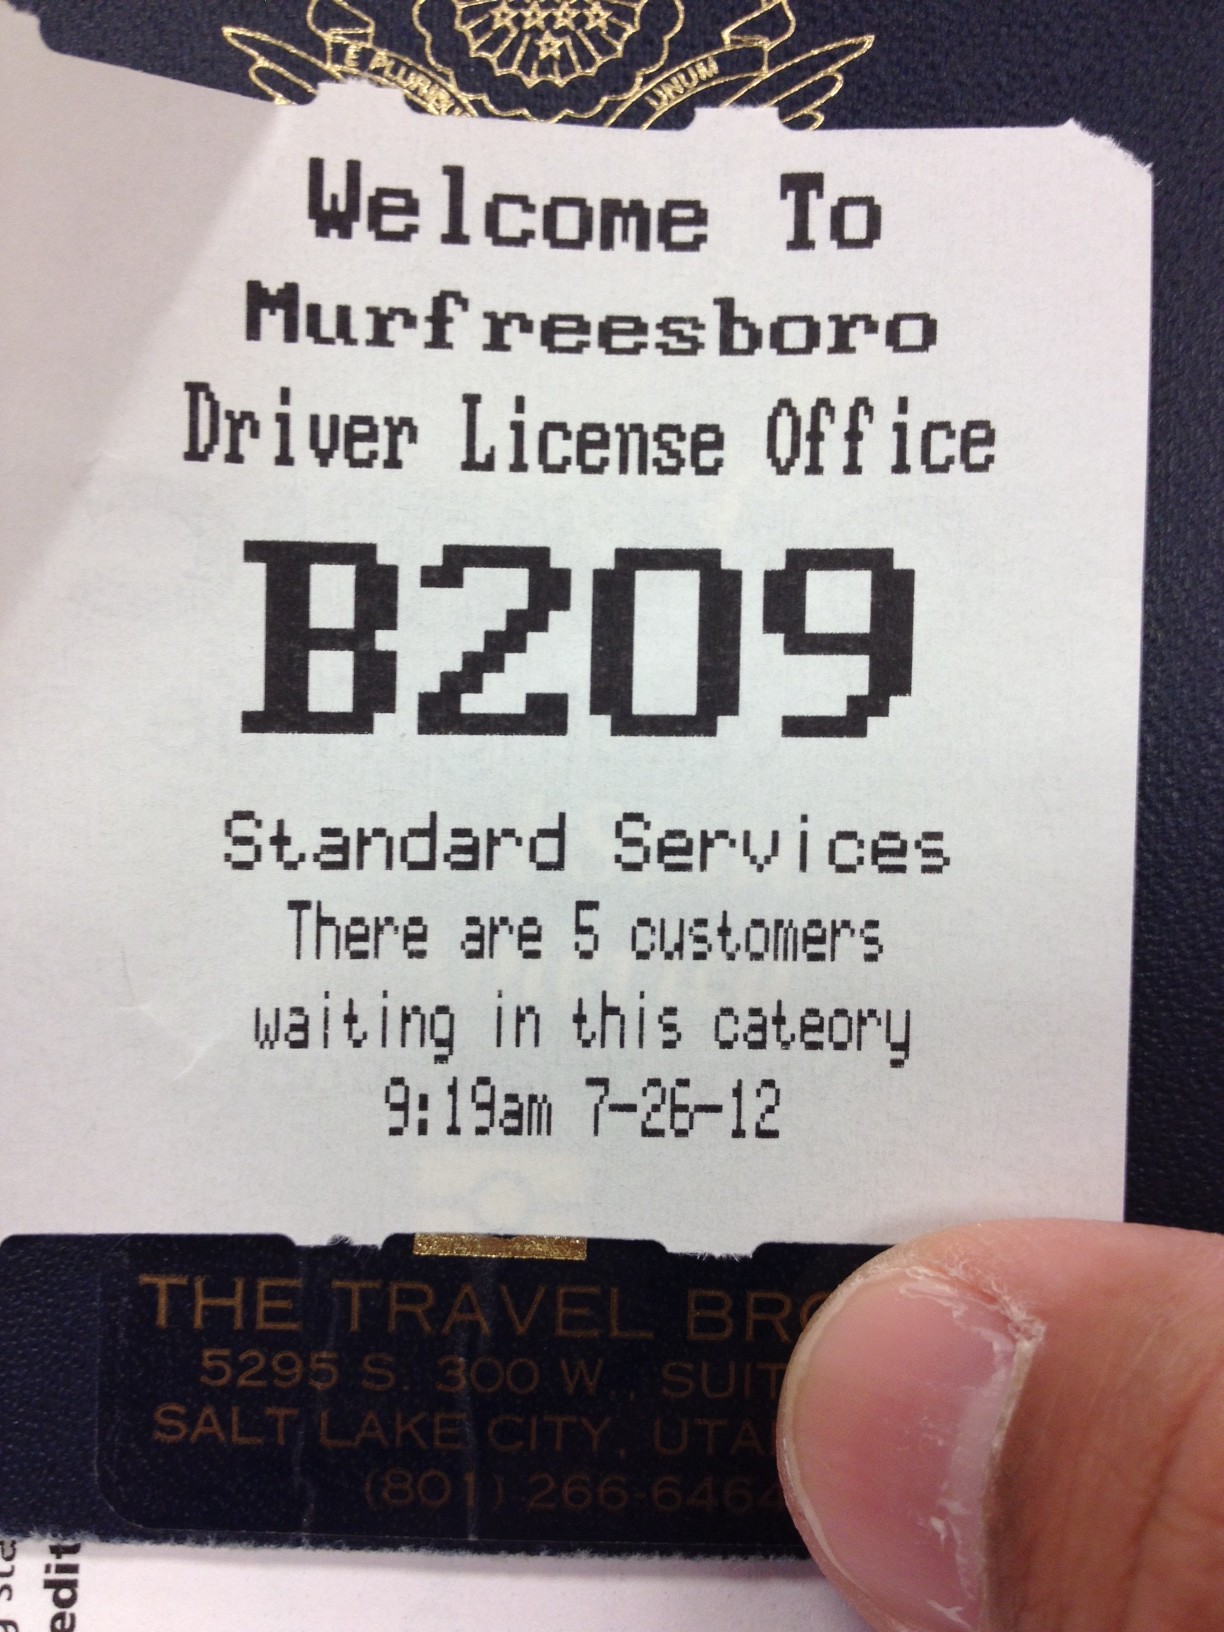
After of about 17 minutes of waiting, I finally made it to the point in the line where I could get a number. Below is my Queue number.
DMV Queueing Results
For the 31 minutes I collected data, below are the key takeaways:
DMV Waiting Line Key Takeaways (31 minutes)
| Average Service Time | # of Arrivals | # of Departures |
| 143 Seconds Per Customer | 9 Arrivals | 11 Departures |
Graphs and Charts
Given the data above, below are a few results of my time at the DMV and the Queueing properties at the Department of Motor Vehicles waiting line:
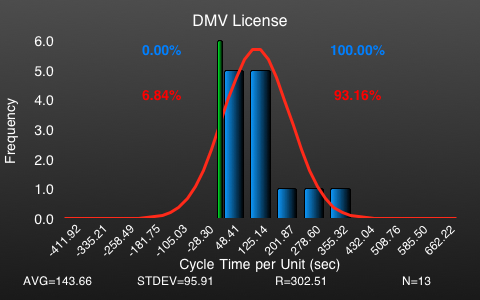
This chart tells us the distribution of Service time. Given the 13 observations, it took an average of 143 seconds to serve a customer. Not bad.
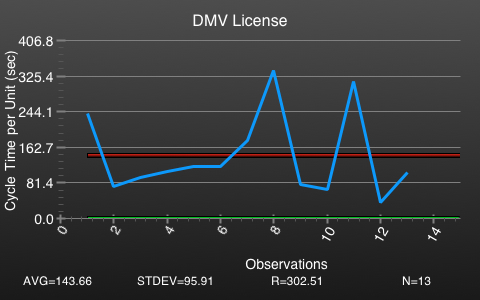
This chart is another picture of service time – this is a run chart perspective.
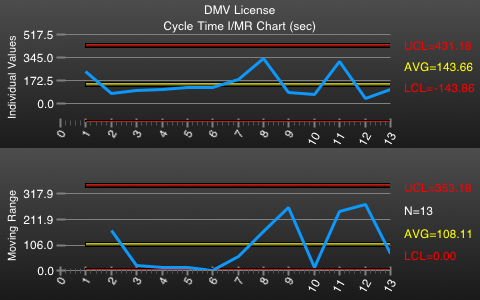
Okay, a negative Lower Control Limit (LCL) makes no sense, but that is what the iPhone Cycle Time app gave me. So, I just posted it here for fun. But, in practice – there is no practical or theoretical use for negative LCL.
Now, this chart shows us a Control Chart of the Service Time – not really helpful given the number of observations, but it’s another picture.
All in all, this DMV treated me well and worked very efficiently. The DMV officers worked well and fast and kept up with the length of the Queue by the evidence of customers exiting more than customer were entering. For a busy operation such as the DMV, this is a good property to see, where the exit rate is faster than the enter rate.
The line of customers at the Jacksonville license tag agency was so long Friday that one customer wondered aloud whether prisoners were in a back room making the plates.
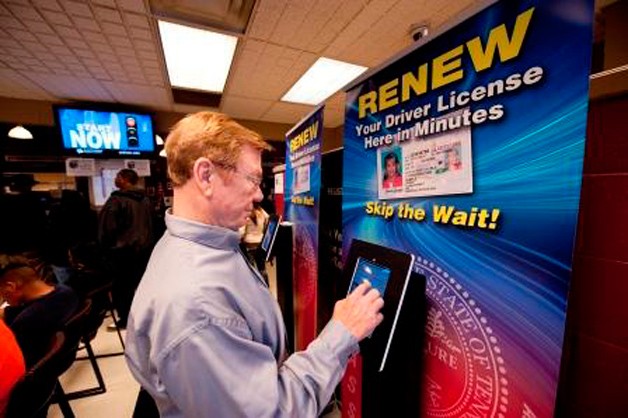
Aside from the DMV officers working faster and more effectively, they have also employed a self-service within the building that has helped to increase velocity. Below, you’ll see their use of the Apple iPad in helping customers renew their Driver’s License.
Unfortunately, because I’m new to the state of Tennessee, I wasn’t able to use the Apple iPad to get my license – but I could see that those self-service lines were faster than the DMV officer lines.



Here’s a comment from a member of the INFORMS group on Linkedin: