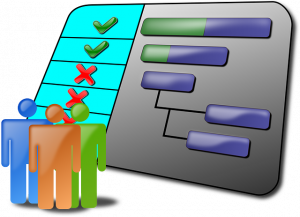
Pop Quiz: How do you read a Gantt chart? In Six Sigma, the Gantt chart can make your project run a whole lot smoother. For great project planning, scheduling always needs to be considered. This is why you may want to invest in a little extra training for your team. That way, your project will run smoothly and on time, with minimum setbacks. In today’s article, we talk about the Gantt chart and how this scheduling tool can help you with your Six Sigma project.
What is a Gantt Chart?
Before you start using Gantt Charts, you must understand what they are, and how they fit into your Six Sigma toolkits. First of all, a Gantt chart is used for purposes of project management. It’s a popular and effective method of displaying activities, tasks or events against a period of time. Each activity is represented by a bar on the chart. The size and position of which show the start date, duration and end date of the activity. Gantt charts will typically illustrate such things as:
- The activity in question.
- When the activity begins and ends.
- How long it lasts.
- Where activities overlap.
- When the project begins and ends.
But why use a Gantt chart? What does it offer? Well, by using one, it can help determine responsibility for tasks, as well as potential problems that may occur. This information can be very useful to have in the early stages of your project, and the Gantt chart makes it easier to absorb by displaying it in a visual manner. It can also help identify critical paths, such as task sequences and minimum delivery times, so don’t dismiss the Gantt chart as just another Six Sigma tool. It could make your project far simpler to deal over time.
How to Use a Gantt Chart
Below are the key steps involved in creating a strong Gantt chart that is bound to be an effective asset to your project:
- Identify the Essential Processes. All your activities necessary to project completion need to be included if a Gantt chart is to work. Establish your essential tasks by breaking down the processes to determine importance. Calculate timescales for delivery before ranking them by length.
- Identify the Task Relationships. Your chart should illustrate how project tasks are linked and how they affect one another (sequential tasks), and how they work when independently (parallel tasks). Remember, some tasks rely on other tasks being completed beforehand, so bear this in mind when designing your chart. For example, your need to have finished an article before it can be posted online.
- Input Activity Data into a Template. Software like Gantto, Microsoft Project or Excel, and Matchware can also be used for this purpose. But sometimes, creating your own template is the best option.
- Track the Progress. As your project makes progress, it will start to change, so be sure to keep track of how. Regularly update your chart with new information, to ensure it is up-to-date and completely accurate. The better your data, the more likely your Six Sigma success!


No responses / comments so far.